|
Orange-BOX delivers array container infrastructure as a service, offering organizations high-performance, yet simple, public cloud and private cloud software solutions for today’s demanding real-time web and mobile applications.
OBX architecture is on a mission to reinvent infrastructure monitoring and troubleshooting for today’s distributed, massively scaled world. It is dedicated to solving the biggest challenges faced by operations teams managing modern IT infrastructures. It should be intuitive. It should be modern and elegant. It should make you more productive. More powerful. And it should be, dare we say, fun to use. |
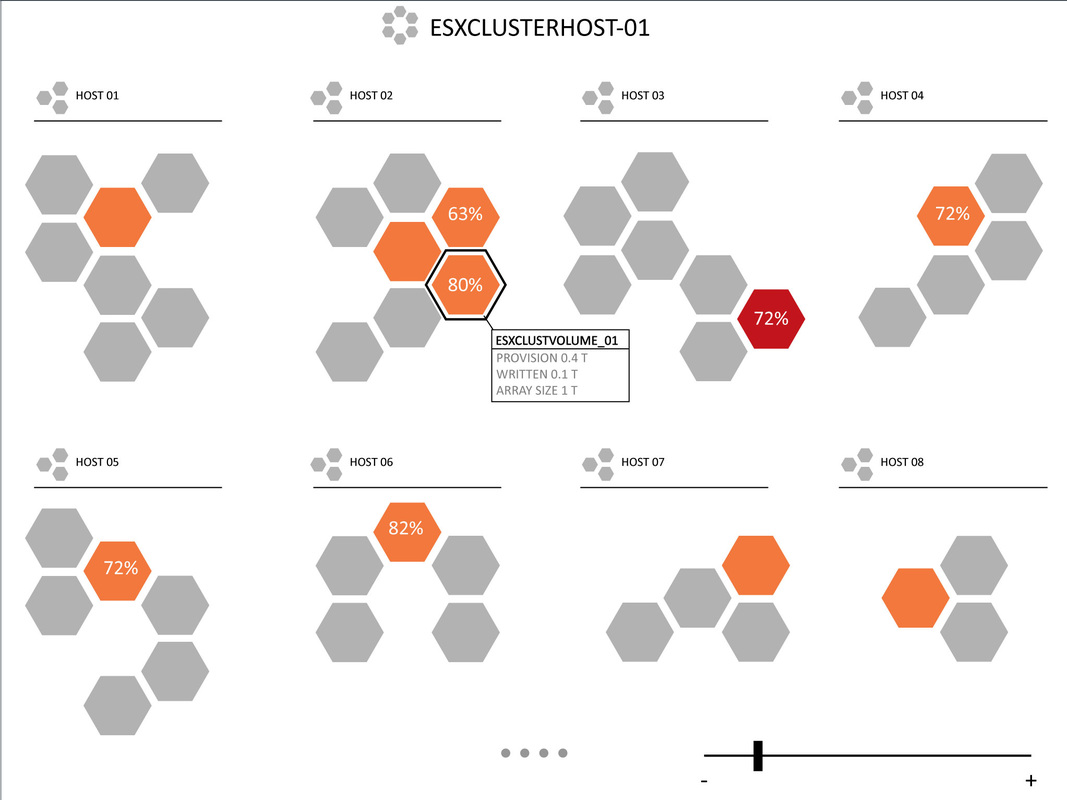
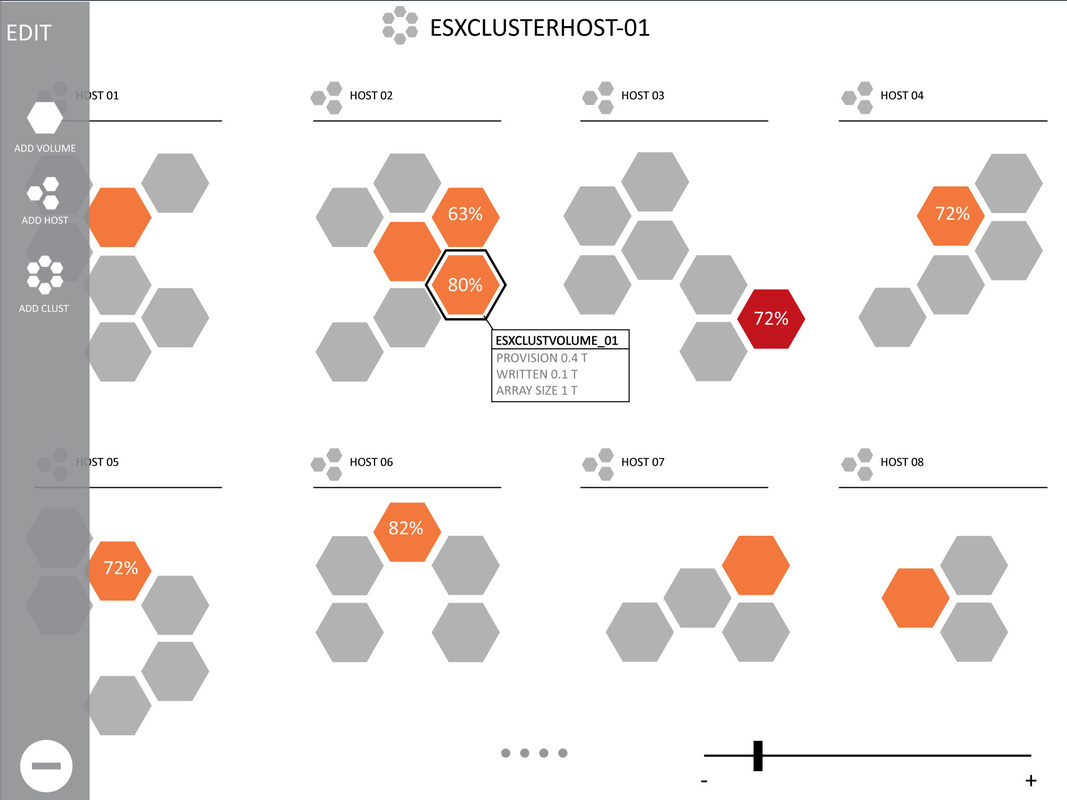
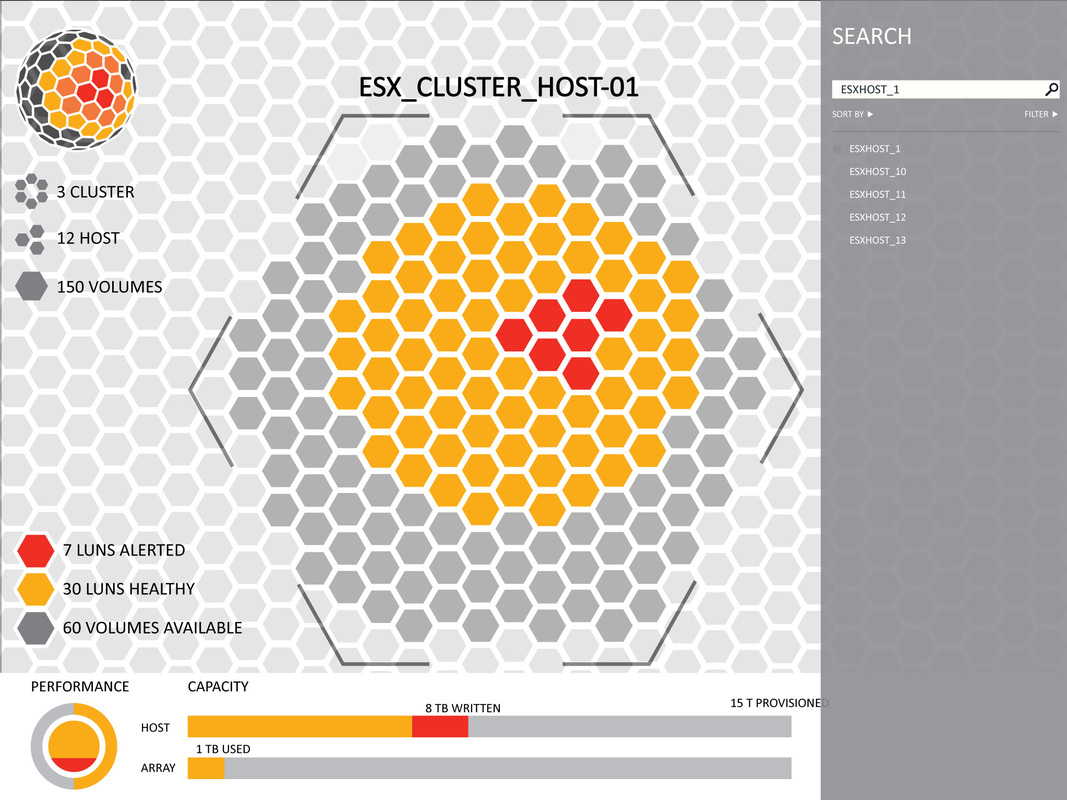
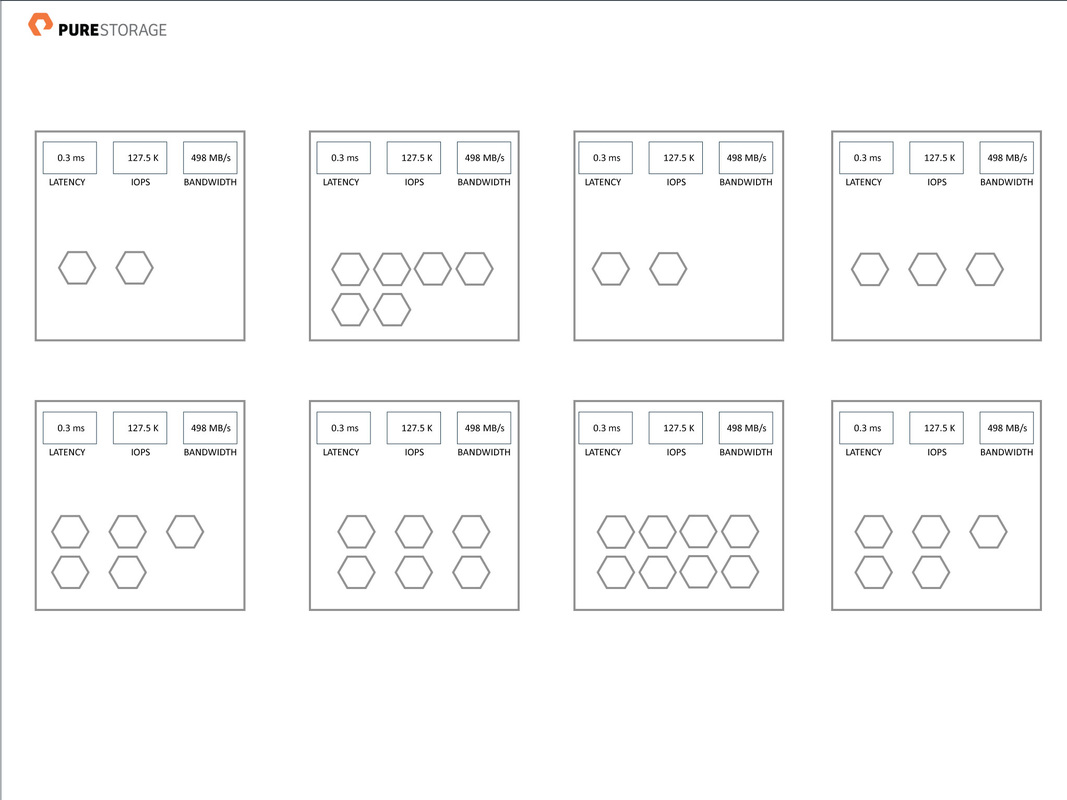
obx visualizations have been created to illustrate different ways to observe device utilization on large scale environments.
|
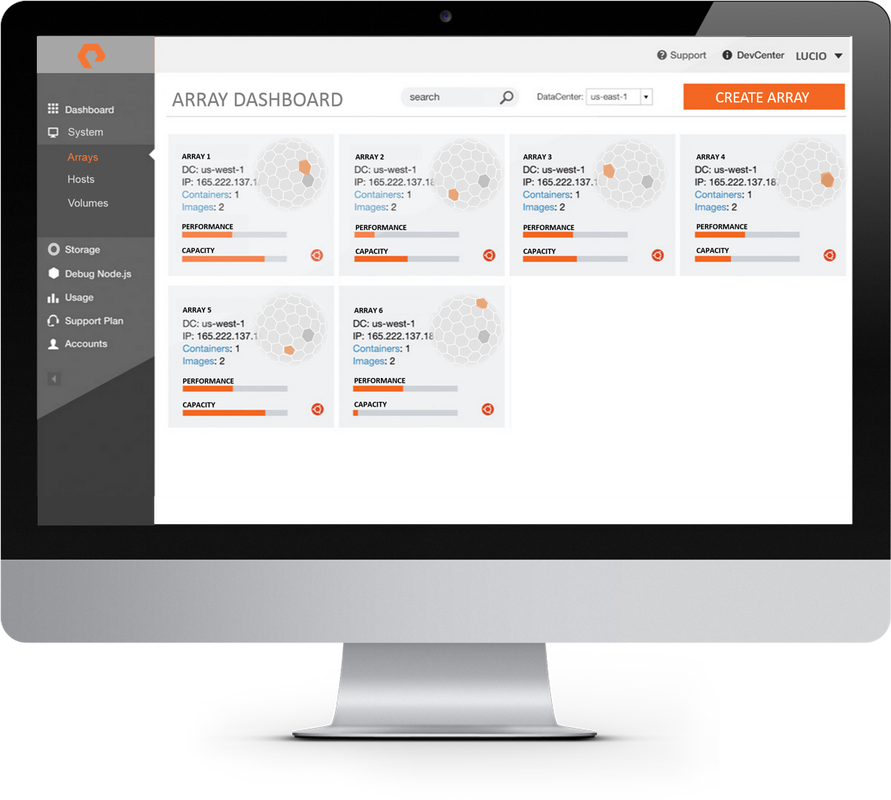
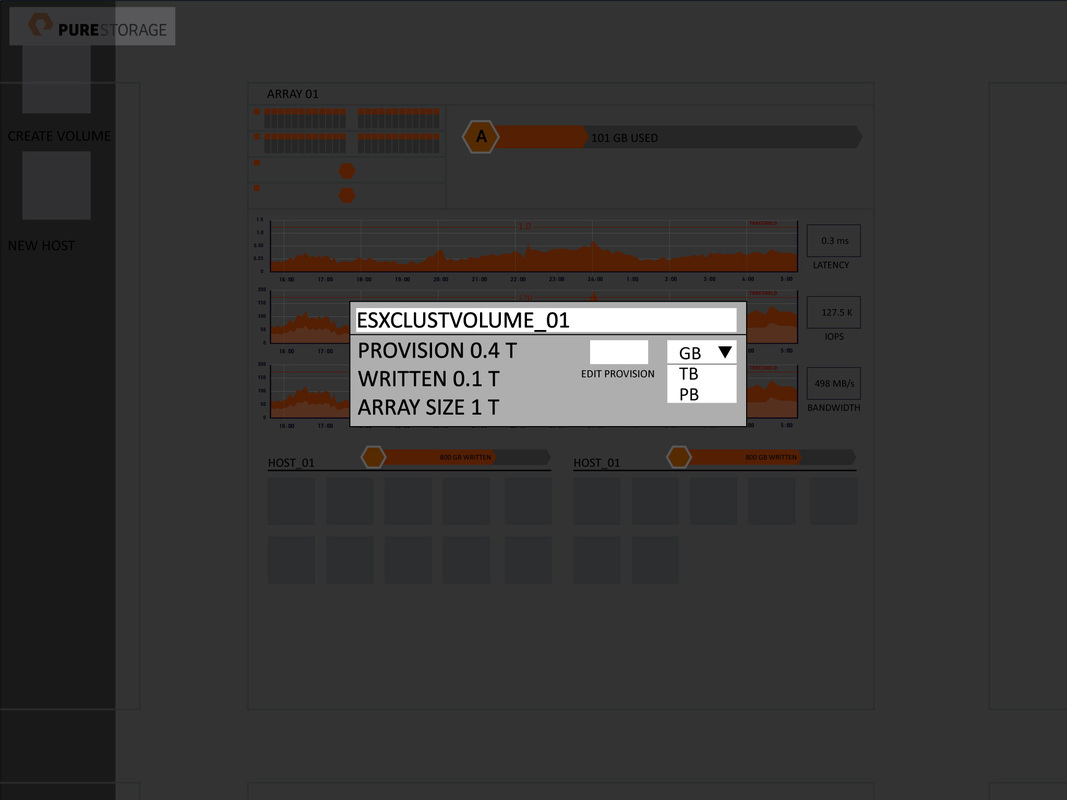
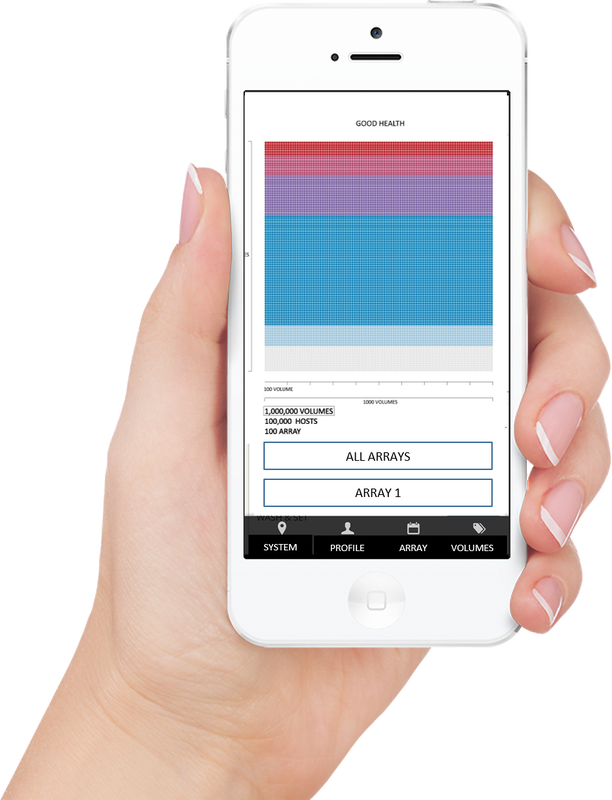
OBX is an intuitive self-service interface so you can easily provision, configure, and manage storage and compute capacity. You can have your own private, dedicated cloud environment up and running in minutes.
|
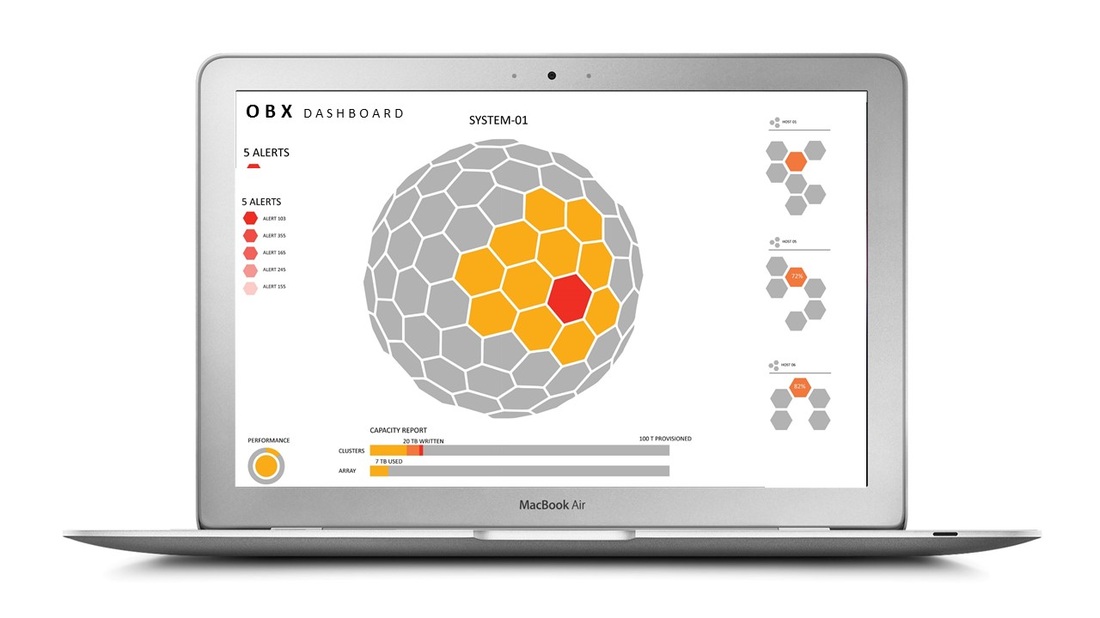
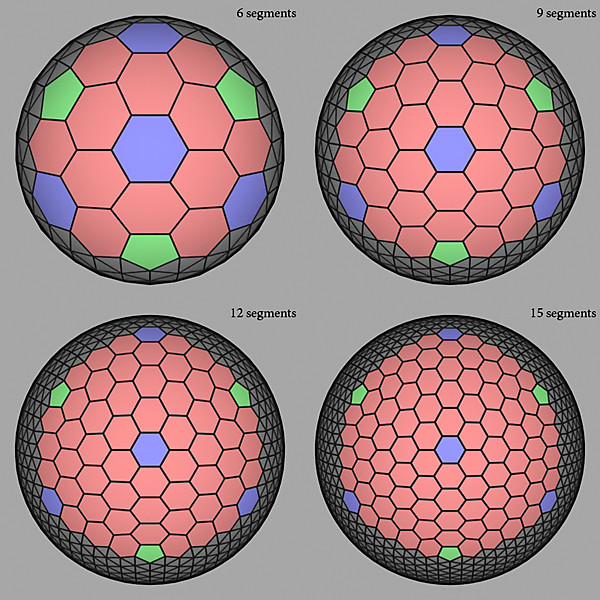
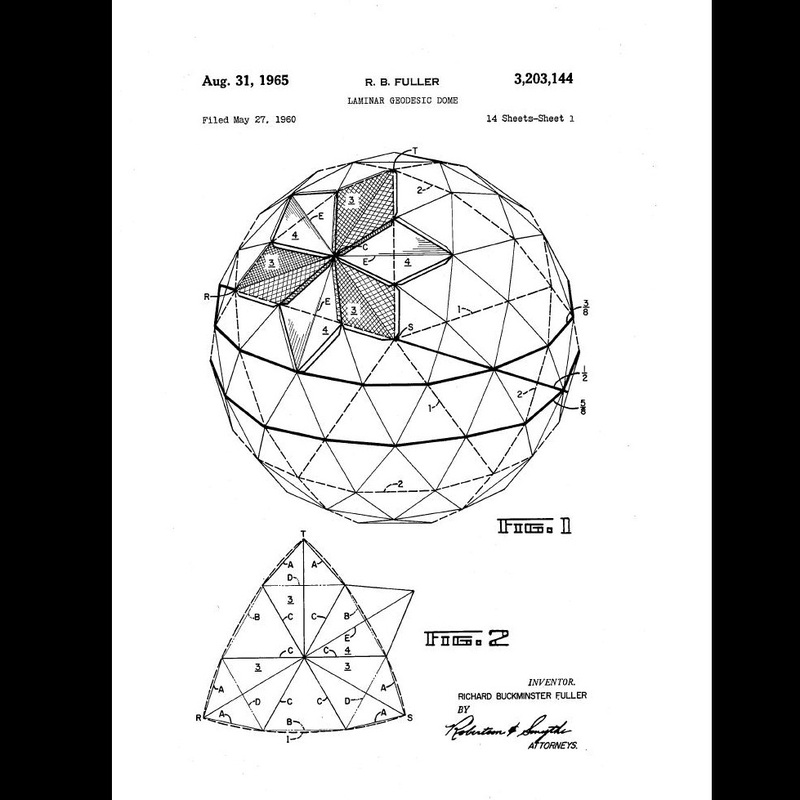
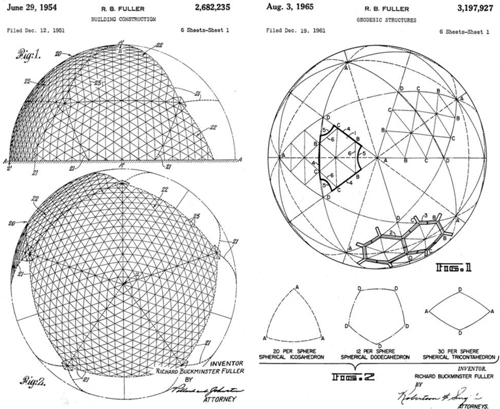
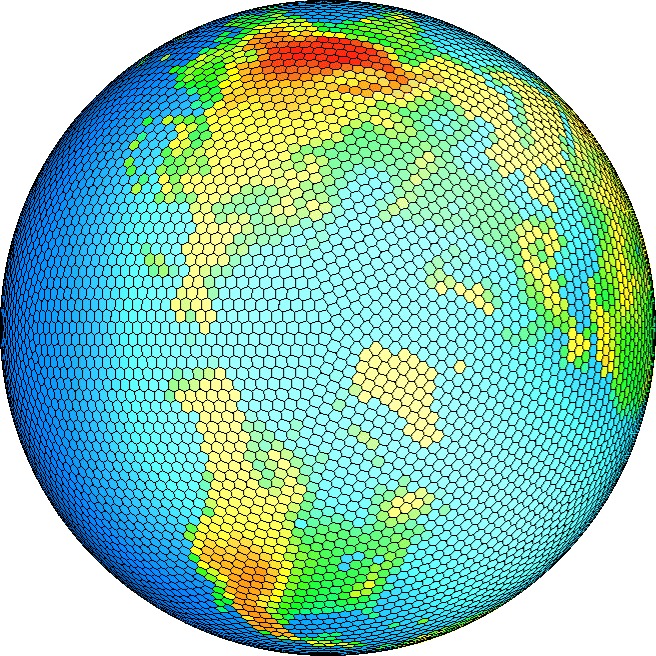
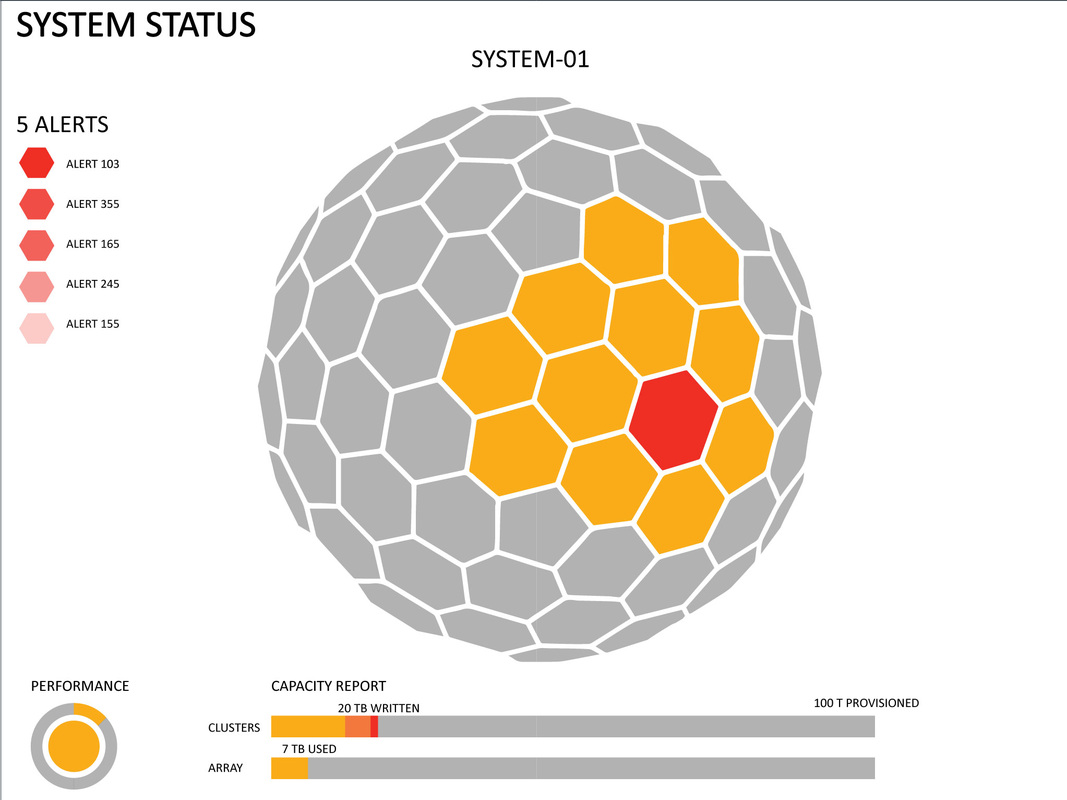
Hexagonal binning Architecture
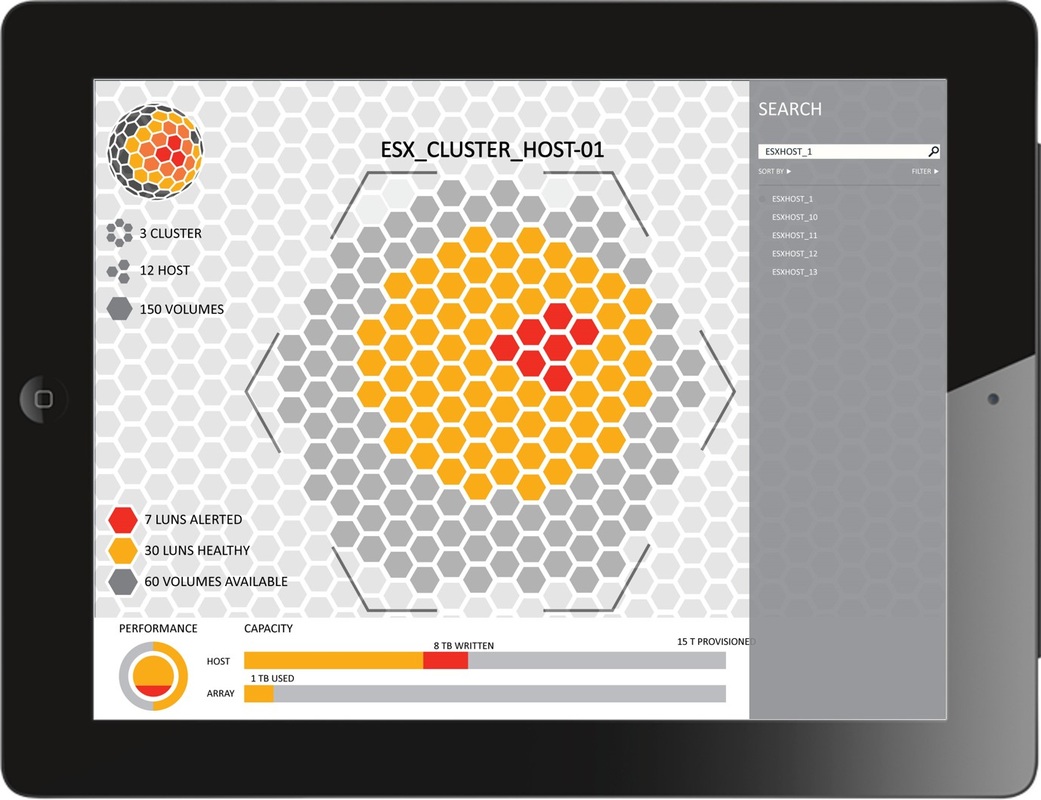
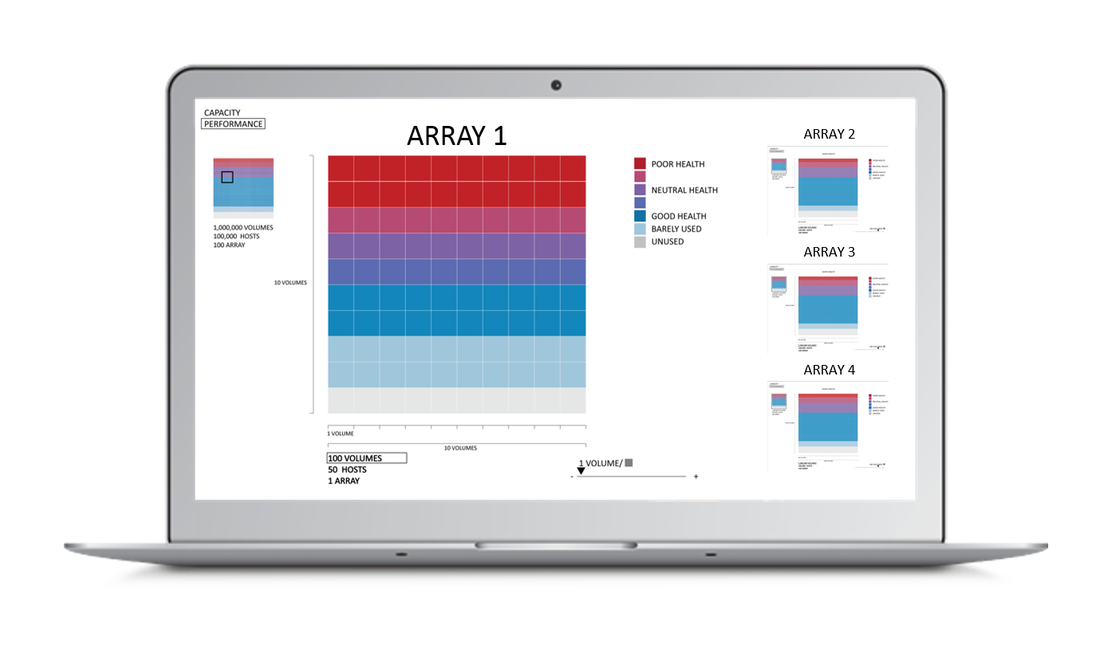
obx adds heat map to storage arrays

|
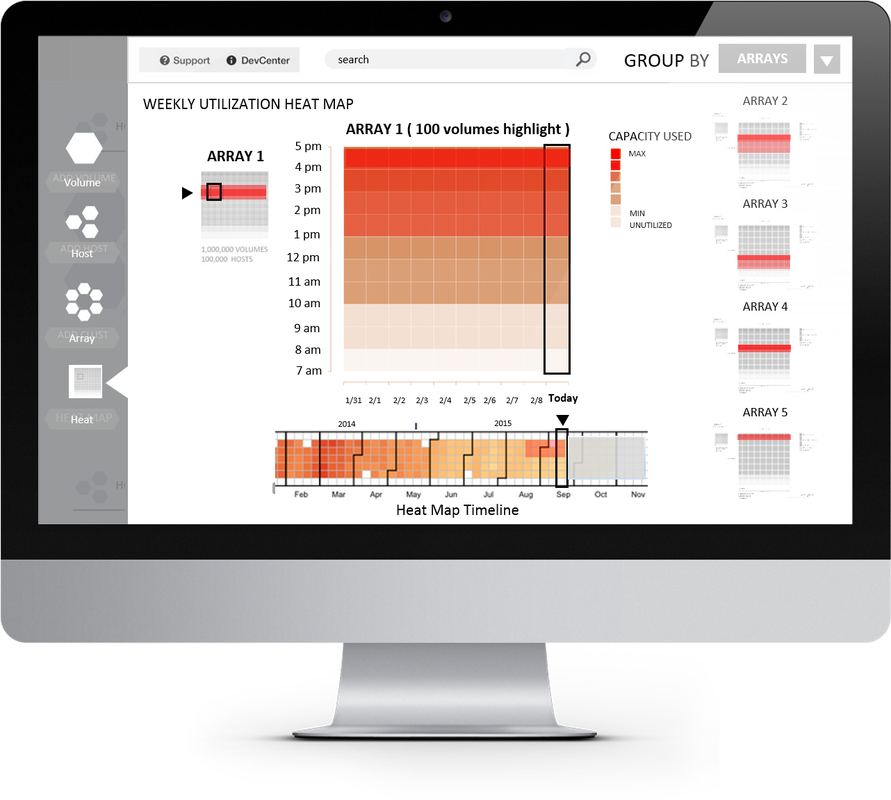
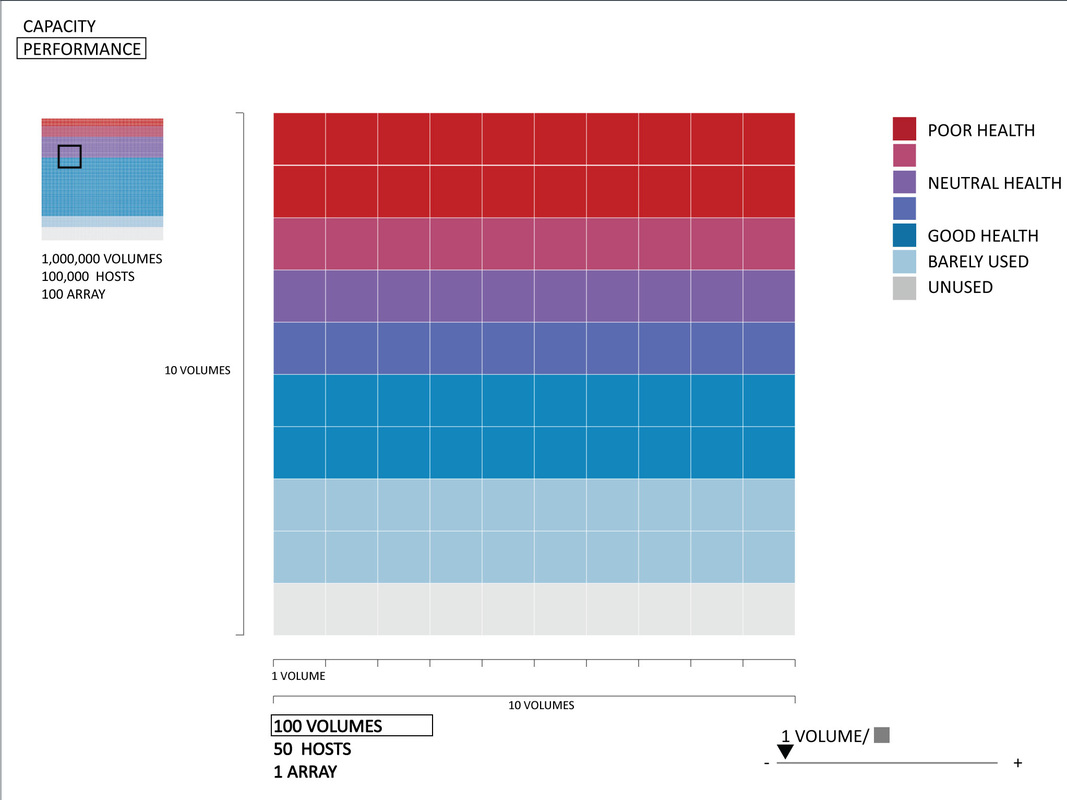
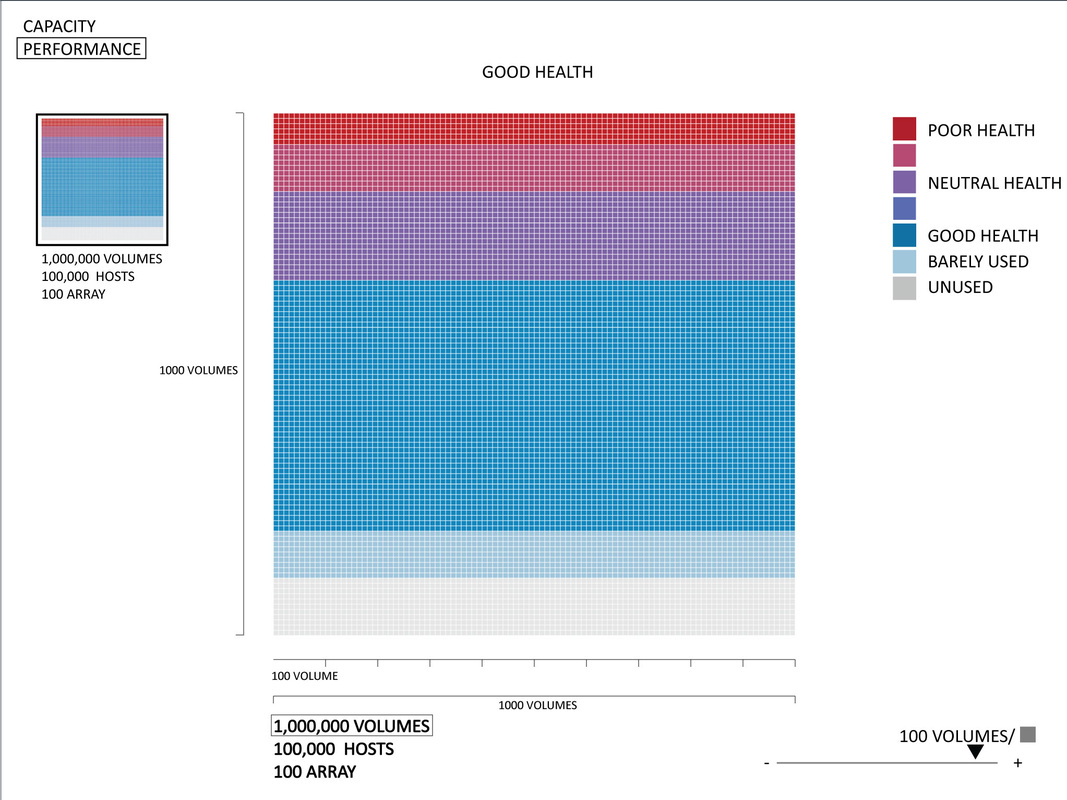
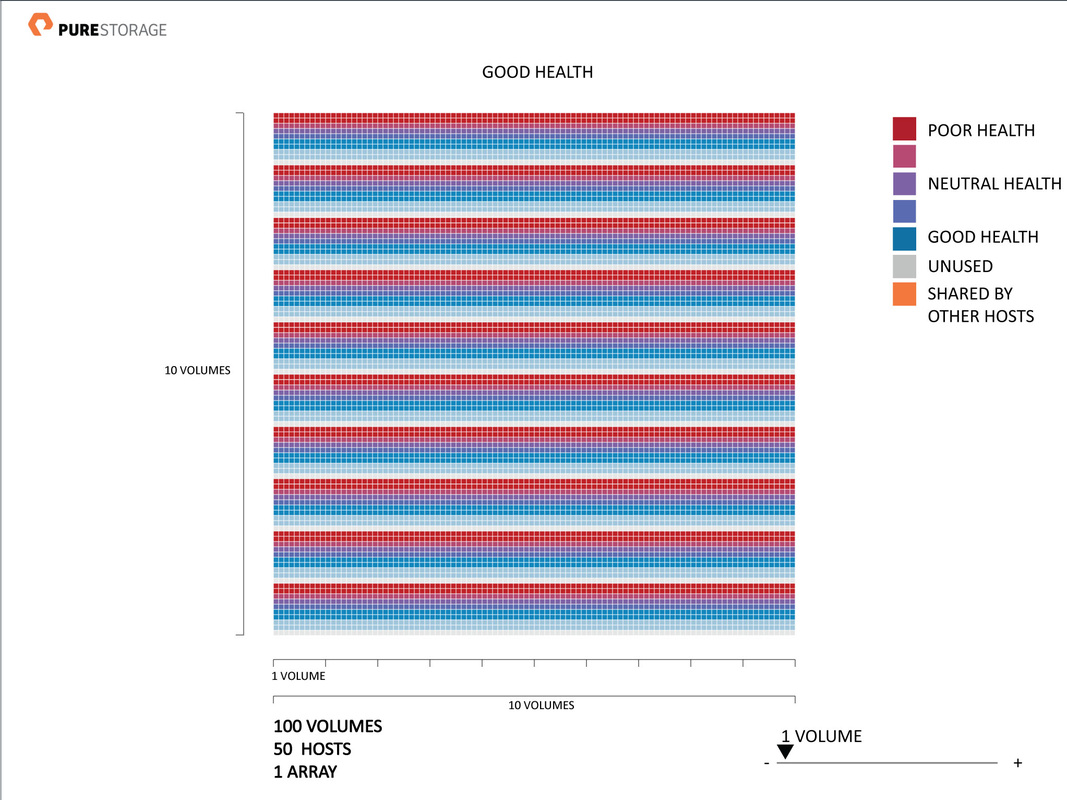
Quantized Heat Map: to identify single or multiple-group devices at 100% utilization, minimum and maximum device utilization, and device utilization balance, all over time.
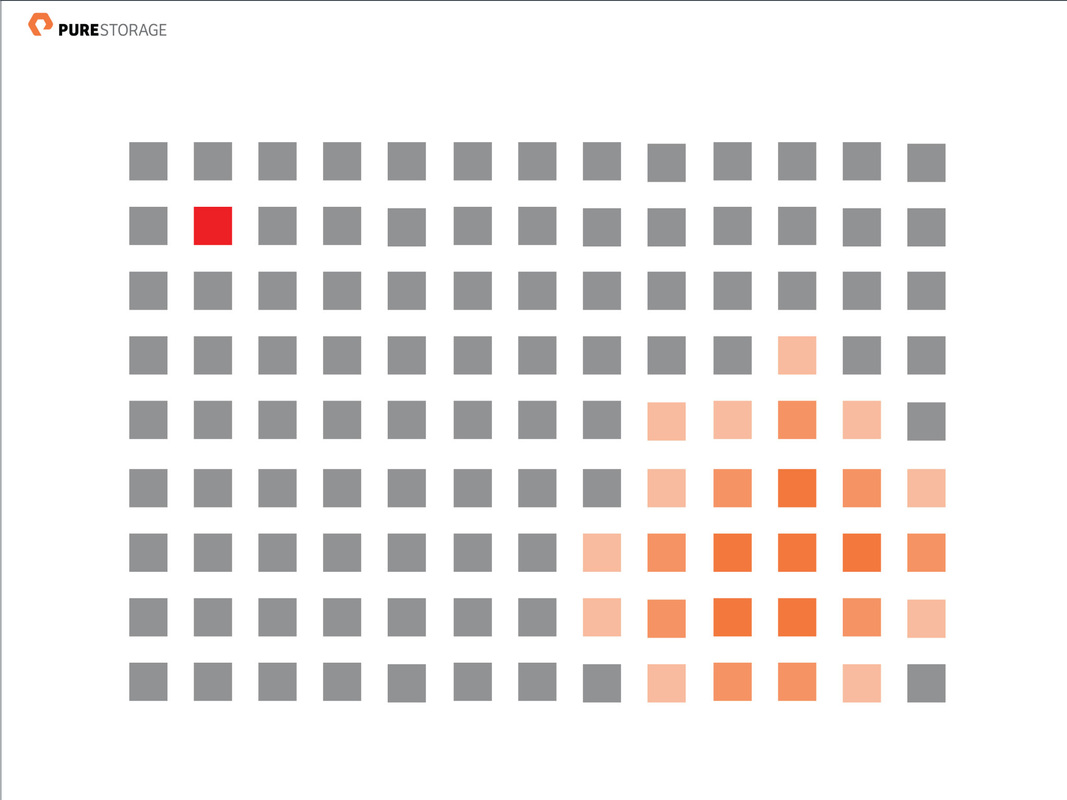
To visualize the distribution of utilization over time, a heat map can be created with time in hours on the x-axis and time in days on the y-axis. The heat map is a color-shaded matrix of pixels, where each pixel represents a unit or a group of units ( in this picture 1 volume/square). The amount of utilization that occurs in that time is shown by the color shade of the pixel: darker colors for max utilization, lighter colors for less. Apart from showing the utilization distribution, the heat map also conveys details on time patterns utilization by looking where the darkest colors are grouped. 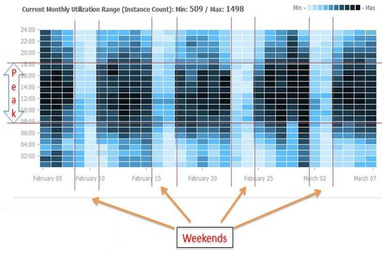
from utilization heat maps you can see patterns of utilization and where you are wasting resources
|
design by Lucio Campanelli
lucio@inpulse.org
lucio@inpulse.org
resources, references and sketches


Some Resources:
http://www.meccanismocomplesso.org/en/hexagonal-binning/
http://www.purestorage.com/company/
http://doc.dataiku.com/dss/latest/visualization/std_charts.html#hexagonal-binning
http://www.theregister.co.uk/Print/2013/03/12/newvem_aws_heat_map/
https://sysdigcloud.com/
https://itzikr.wordpress.com/2012/09/02/the-vnx-storage-analytics-suite/
Other resources:
Video about the importance of Information Visualization for large data architecture:
http://www.ted.com/talks/david_mccandless_the_beauty_of_data_visualization#t-1068913
Heat map video reference:
https://www.youtube.com/watch?v=oVKfoA_cujY
Cotrail storage solution manager from Juniper network
https://techwiki.juniper.net/Documentation/Contrail/Contrail_Controller_Getting_Started_Guide/30_Installation/50_Contrail_Storage_Support
Datapipe service monitoring infrastructure
http://www.datapipe.com/optimized_it_services/managed_services/monitoring_services/
Newven heatmap
http://www.theregister.co.uk/Print/2013/03/12/newvem_aws_heat_map/
Calendar heatmap
http://blog.revolutionanalytics.com/2010/12/how-orbitz-uses-hadoop-and-r-to-optimize-hotel-search.html
code for calendar heatmap:
http://stackoverflow.com/questions/2076370/most-underused-data-visualization
code 2 for calendar heatmap
http://blog.revolutionanalytics.com/2010/12/how-orbitz-uses-hadoop-and-r-to-optimize-hotel-search.html
hexagonal binning heatmap
http://stackoverflow.com/questions/7714677/r-scatterplot-with-too-many-points
hexagon binning from mapbox:
https://www.mapbox.com/blog/binning-alternative-point-maps/
Article to build hexagonal heatmaps :
http://www.meccanismocomplesso.org/en/hexagonal-binning/
Why using information visualization and D-trace:
http://dtrace.org/blogs/brendan/2011/12/18/visualizing-device-utilization/
Docker and Hans Roseling
http://www.r-bloggers.com/running-rstudio-via-docker-in-the-cloud/
heatmap vmware
https://itzikr.wordpress.com/2012/09/02/the-vnx-storage-analytics-suite/
storage vendors reference:
http://www.gabesvirtualworld.com/tintri-vmstore-vm-only-storage-appliance/
OVH:
https://api.ovh.com/
http://www.ovh.com/us/dedicated-cloud/hardware/infrastructure/hosts/
http://www.meccanismocomplesso.org/en/hexagonal-binning/
http://www.purestorage.com/company/
http://doc.dataiku.com/dss/latest/visualization/std_charts.html#hexagonal-binning
http://www.theregister.co.uk/Print/2013/03/12/newvem_aws_heat_map/
https://sysdigcloud.com/
https://itzikr.wordpress.com/2012/09/02/the-vnx-storage-analytics-suite/
Other resources:
Video about the importance of Information Visualization for large data architecture:
http://www.ted.com/talks/david_mccandless_the_beauty_of_data_visualization#t-1068913
Heat map video reference:
https://www.youtube.com/watch?v=oVKfoA_cujY
Cotrail storage solution manager from Juniper network
https://techwiki.juniper.net/Documentation/Contrail/Contrail_Controller_Getting_Started_Guide/30_Installation/50_Contrail_Storage_Support
Datapipe service monitoring infrastructure
http://www.datapipe.com/optimized_it_services/managed_services/monitoring_services/
Newven heatmap
http://www.theregister.co.uk/Print/2013/03/12/newvem_aws_heat_map/
Calendar heatmap
http://blog.revolutionanalytics.com/2010/12/how-orbitz-uses-hadoop-and-r-to-optimize-hotel-search.html
code for calendar heatmap:
http://stackoverflow.com/questions/2076370/most-underused-data-visualization
code 2 for calendar heatmap
http://blog.revolutionanalytics.com/2010/12/how-orbitz-uses-hadoop-and-r-to-optimize-hotel-search.html
hexagonal binning heatmap
http://stackoverflow.com/questions/7714677/r-scatterplot-with-too-many-points
hexagon binning from mapbox:
https://www.mapbox.com/blog/binning-alternative-point-maps/
Article to build hexagonal heatmaps :
http://www.meccanismocomplesso.org/en/hexagonal-binning/
Why using information visualization and D-trace:
http://dtrace.org/blogs/brendan/2011/12/18/visualizing-device-utilization/
Docker and Hans Roseling
http://www.r-bloggers.com/running-rstudio-via-docker-in-the-cloud/
heatmap vmware
https://itzikr.wordpress.com/2012/09/02/the-vnx-storage-analytics-suite/
storage vendors reference:
http://www.gabesvirtualworld.com/tintri-vmstore-vm-only-storage-appliance/
OVH:
https://api.ovh.com/
http://www.ovh.com/us/dedicated-cloud/hardware/infrastructure/hosts/